
Last year I posted a blog ‘How to cure schizophrenic organisations’ (http://www.stratsim.co.nz/new-blog/how-to-cure-schizophrenic-organisations).
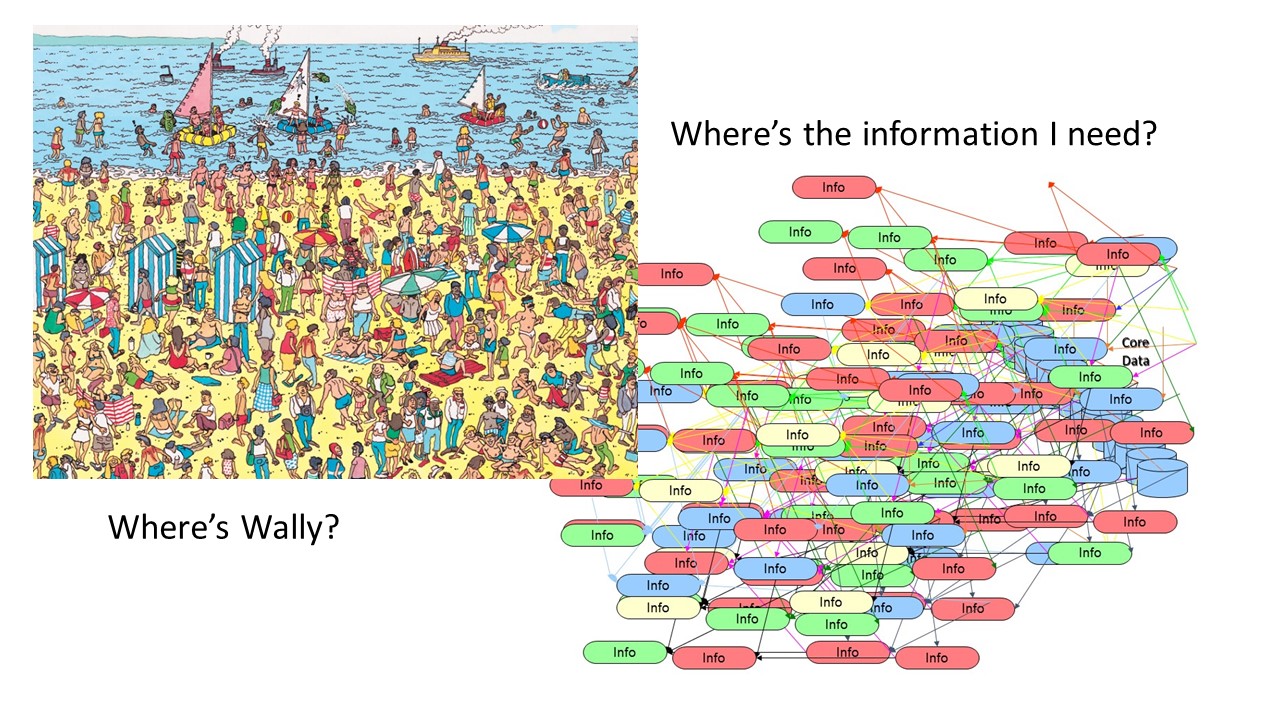
My proposition in that blog was that organisations, like sufferers of the neurodevelopmental disorders autism and schizophrenia; have an information-gating deficit i.e. poor processes for separating the information ‘chaff’ from the critical and important. Everyone, from customers, staff to senior managers struggle to figure out what they should be paying attention to; and what to ignore. There is information coming at them all at once, at the same speed, at the same volume. It’s the information equivalent of ‘Where’s Wally’.
In their October 2015 article: “The Journey to Government’s Digital Transformation”, Deloitte conclude that ‘Successful public bodies will be more flexible, adapting to the one constant of the new digital age: change itself [and that a] lack of strategy is the leading barrier impeding organizations from taking full advantage of digital trends’.
The ‘Where’s Wally’ problem described above is really just a symptom of organisations whose information dependent objectives are thwarted by (as Deloitte put it) ‘cultures, processes, and skill sets that are out of step with a technologically advanced, citizen-centric era [but who’s] leaders are [inevitably] required to make decisions more quickly in the face of a constant evolution’.
That’s a ‘pretty big job’. I want to take a look at an emerging methodology, LINQ that we’ve used to support organisations in developing and implementing a digital information strategy. LINQ has some similarities to Google Maps.
Let’s go back to this concept of Information-Gating. How to zoom-in for fine detail AND zoom-out again to the big picture, on-demand, in a joined-up fashion that doesn’t take weeks or months? Google Maps does this really well by filtering out the detail as you zoom out. You can be down in the weeds, looking at an individual house; or zoom out to the whole country. At an organisational view; looking at an individual process, but also how that fits into the entire organization.
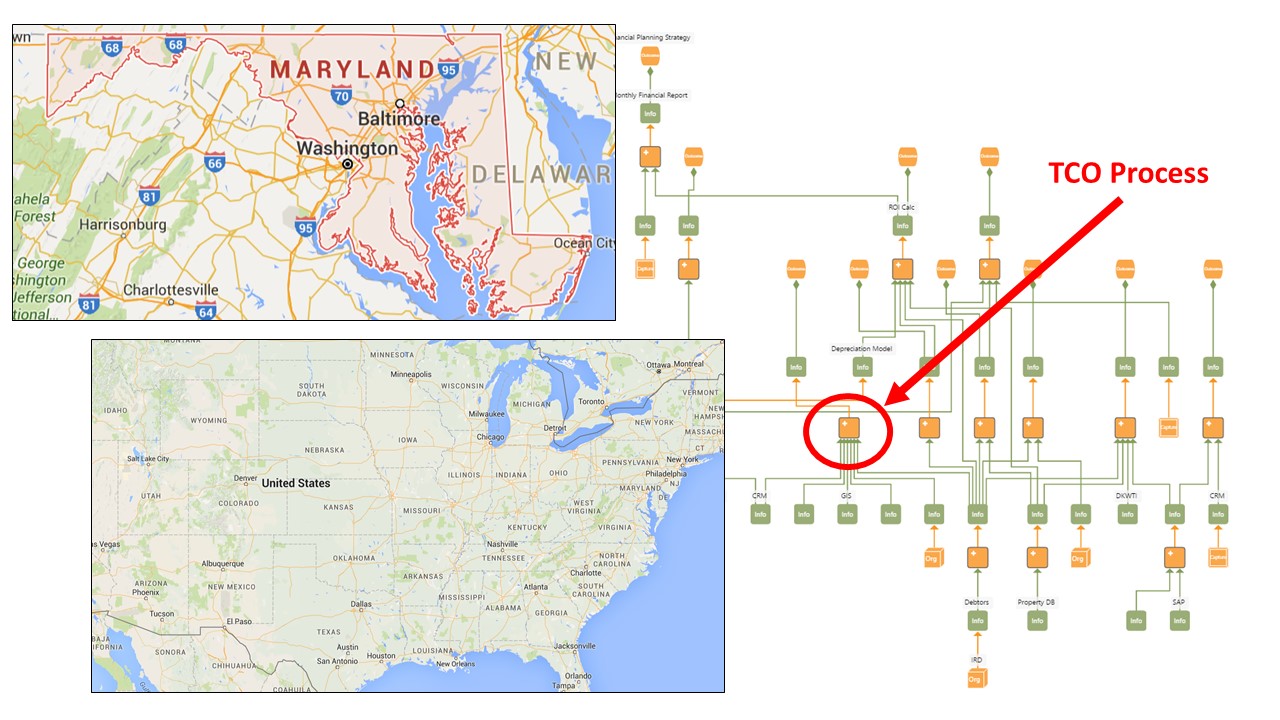
Take this example of a nice bungalow at 2230 Lake Ave, Baltimore, Maryland 21213, United States of America. Below we have the street-level view of the property; building, road and utilities. This is the equivalent of looking at an individual process within the organization; in the example below a TCO Calculation performed by ‘Brian’. We can even capture relevant data about this process; Brian’s overhead hourly rate ($86.00), the duration and frequency of the process he performs (2 hours each Monday, Tuesday, Wednesday and Thursday) and the annualized cost of the process; $35,776.00.

In Google Maps, as you zoom out the less-relevant information is ‘gated’ (removed) while the more relevant information at this level of enhanced. The organisational view below; we’re no longer interested in an individual process but rather the group of processes or the team if fits within. In the example below we can see the ‘TCO Calc’ process is part of a larger ‘TCP Process’ and by adding the annualised cost of all the processes in the group we have an annualized cost of $89,000.00 per year. This view is the equivalent of zooming out to a city view of Baltimore in Google Maps (below) where 2230 Lake Ave and Lake Ave itself has disappeared (although, like the LINQ model, we know we can go back down to that level at any time).

And so in Google Maps we can keep moving out to a wider view; the whole State of Maryland perhaps representing a whole Business Unit (below) and eventually right out to the entire USA providing a view of the whole organization. In the LINQ diagram below the entire TCO Process is collapsed to a single node because at this organizational view, that is all we need or want for context. In Google Maps we can easily se where Maryland is relevant to the country-view, or where the TCO process fits with the wider organisation.
As with Google Maps, the underlying information-supply-chain data in LINQ remains joined-up, albeit hidden and, like Google Maps we can dive straight back into the original detail on demand; or perhaps into another part of the map/organization i.e. Billings Montana/Asset Assessment Process.

Organisations we work with are wanting to reach a standard that when someone asks 'Where's Wally'? you want to cut through the noise and be able to say: ‘Wally is here’

This information-supply-chain approach behind LINQ is an extraordinarily simple but powerful approach that organisations can use to identify what to pay attention to and what to ignore but like any tool, to be successful that cannot happen in isolation. On this point Deloitte are unequivocal, pointing out that Digitally Savvy Leadership is a game changer. Successful organisations have a clear digital strategy targeting fundamental transformation with collaboration frameworks, agile planning and implementation methodologies, innovation by design (http://www.stratsim.co.nz/new-blog/innovation-by-design-kill-the-chicken-pt-iii) risk management and adaptive procurement policies to name a few. All tuned for quickly identifying and taking full advantage of emerging digital trends. That is what separates those organisations from the ‘also-rans’.
At StratSim we live to do this work for our customers; digital strategy coupled to practical plans that deliver results. If that sounds like you, please feel free to give us a call.
The journey to government’s digital transformation - Deloitte:
http://dupress.com/articles/digital-transformation-in-government/